
Most AI coding agents – Claude Code, Cursor, Codex, and others – default to plain keyword search. We measured what that actually costs against three graph-based alternatives, on two real Java codebases, cold, once, with every number reported as it printed.
The default nobody actually chose
Most AI coding agents fall back to plain keyword search the grep approach, because it’s simple and always available. No setup, no index to build, no extra dependency. For a single, isolated question, that’s completely fine: “where is this constant defined” doesn’t need anything smarter than a fast text match.
The problem shows up once the question stops being about text and starts being about relationships.
Where it breaks: a walkthrough
Say you’re implementing a checkout flow — a fictional example, but the shape will be familiar. An order comes in, gets validated, goes through payment, updates inventory, and triggers a confirmation. Call the pieces OrderService, PaymentGateway, InventoryService, and NotificationService — dummy names standing in for whatever your real system calls them.
- Understand the entry point: The agent has to find where a checkout request first lands, and re-derives this from scratch with a keyword search.
- Trace validation and payment: Every hop — order to payment, payment to inventory — means another round of searching and re-reading files to guess at the connection.
- Wire in the new logic: The agent now holds enough context to make the change — but only for this one prompt.
- Come back tomorrow to extend it: With plain search, none of yesterday’s discovery carries over. The agent starts again at step 1.
That’s the real cost of a search-only default: it doesn’t compound in your favor. Every session re-pays the same discovery cost, whether the task is new or one you already solved last week.
What a graph actually changes
A graph-based context tool doesn’t search text — it holds a map of how the code connects: what calls what, what depends on what, what breaks if something changes. Instead of re-reading a pile of files to guess at a relationship, the agent looks it up.
There isn’t one kind of graph tool, though — they solve different parts of the problem:
| Tool type | What it actually solves |
|---|---|
| grep | Instant keyword lookup. No relationships, no memory — just text matching. |
| CodeGraph | Structural relationships within the codebase — calls, imports, what breaks if something changes. |
| graphify | A knowledge graph spanning many files and languages at once, not just one module. |
| codebase-memory-mcp | Persists what was already discovered, so the next session doesn’t start at zero. |
Where to use what
grep — a single, isolated lookup. Fast and cheap; don’t reach for anything heavier.
CodeGraph-style tools — you need to know what calls what, and what breaks if it changes.
graphify-style tools — the question spans multiple files or languages, not just one.
memory-mcp-style tools — you’re coming back to the same feature across sessions and don’t want to start from zero.
Inside the benchmark: what actually happened, tool by tool
Everything below is from a real, live run — four tools, run cold, once, against the same real questions on two real codebases. Repo names, file paths, and internal command names have been swapped for generic placeholders; every number, pass/fail result, and dollar figure is unchanged.

Four task shapes were run against both repos: disambiguating a duplicate name, resolving an ambiguous same-named caller, resolving a simple unambiguous caller, and tracing a 2-hop blast radius. That’s 8 tasks × 4 tools = 32 task-runs, plus one full index build per tool per repo — every call cold, wall-clock timed, output captured as printed.
One-time cost: building the index
grep needs no index, ever. The other three need one before they can answer anything.
| Tool | Repo A (571 files) | Repo B (28,107 files) | Scaling |
|---|---|---|---|
| grep | 0s — none needed | 0s — none needed | flat, always |
| CodeGraph | 51.5s · 33.2MB | 2h 56m · 1.7GB | ~205x time for ~49x files — super-linear |
| graphify | 46.8s · 12MB | 36m 59s · 1.5GB | ~47x time for ~49x files — closest to linear |
| codebase-memory-mcp | 52.2s · ~223MB | 8m 33s* · 2.3GB | not a clean scaling story — see note |
*The memory-mcp-style tool’s first indexing attempt on the large repo hung for 15m 21s and failed outright with a worker-containment error; a second attempt succeeded in 8m 33s. The graph-style tool’s own generated index file on the large repo (587MB) came in bigger than its own query command’s default 512MB safety cap — every follow-up query failed until that cap was raised by hand. The structural-graph tool’s first attempt on the large repo also died silently mid-run and left a lock file blocking a clean rebuild.
Four tasks, both repos
Time = wall-clock to the answer that was actually used. Output = characters returned (a rough proxy for tokens an LLM would spend reading it). Result marks whether the first call alone was trustworthy.
Task 1 — disambiguate a duplicate-named interface
Repo A: a symbol with 2 same-named interfaces · Repo B: a symbol with 3 same-named interfaces across 2 sibling projects
On repo A, grep found the real implementation but never surfaced that a second, separate interface shared the same name. CodeGraph-style disambiguated both interfaces and every real usage site in one call. On repo B, a plain scoped search found 3 legacy implementations but missed a third interface entirely — it lived in a sibling sub-project outside the search’s scope. The graph-style tool’s own index file exceeded its own safety cap and failed before it could even answer.
Task 2 — callers of an ambiguous same-named method
Repo A: a method name shared with an unrelated utility · Repo B: a method name shared by two unrelated classes, one with private overloads
The memory-mcp-style tool’s ambiguity handling was the most helpful failure of any tool in the whole benchmark: on repo A it flagged the name as ambiguous and listed the exact two real candidates to choose from. At repo B scale, that same tool’s first suggested candidate returned a false-negative “0 callers” — wrong, not just incomplete — until re-pointed at a different qualified name, which then returned a plausible 79 callers. The structural-graph tool split the two same-named methods apart correctly but missed one direct-instantiation call site.
Task 3 — callers of a simple, unambiguous method
The case every tool should nail — a genuinely unique method name on each repo.
Everyone agrees when a name is genuinely unambiguous — grep is fastest and cheapest here, and there’s no reason to reach for anything heavier. The one surprise: the graph-style tool’s dedicated callers-lookup came back empty on repo B even though the same symbol provably existed in its own index — a genuine false negative on the easiest task in the set.
Task 4 — 2-hop blast radius
Repo B’s symbol is complicated by 4 unrelated same-named methods elsewhere in the codebase.
grep found only the first hop on both repos by design — pattern matching can’t chase a second hop on its own; it needs a second manual query every time. All three graph-style tools walked the full 2-hop chain in one shot on repo A. On repo B, the structural-graph tool got closest but pulled in several unrelated same-named methods without separating them; the other two graph tools failed outright.
Time and output, side by side — both repos
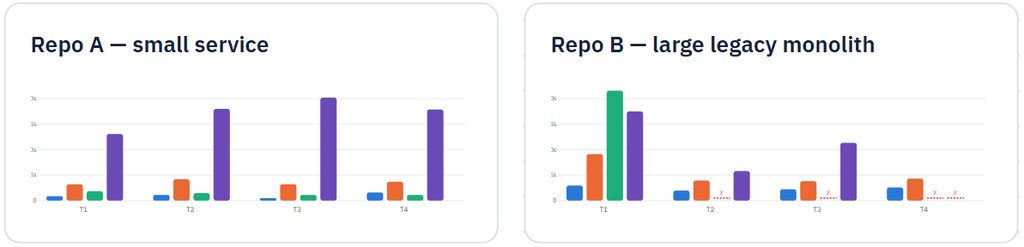
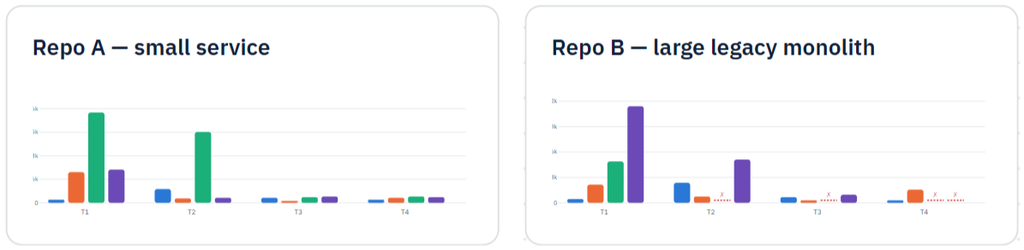
Bars show the call that produced the final, used answer; failed calls are marked ✗ instead of plotted as if they’d produced a real number.
Time to final answer — seconds, wall-clock, lower is faster
Output size delivered – characters in the answer used, a rough proxy for LLM context cost

What “saves tokens” actually means — a worked example
Output size per call measures tokens per call. By that measure, grep usually wins — but that’s an artifact of it often being incomplete, not efficient. What actually matters is total tokens to reach a correct, complete answer. Here’s that measured directly, on the repo B disambiguation task, where the plain search’s real answer missed one of three interfaces entirely.
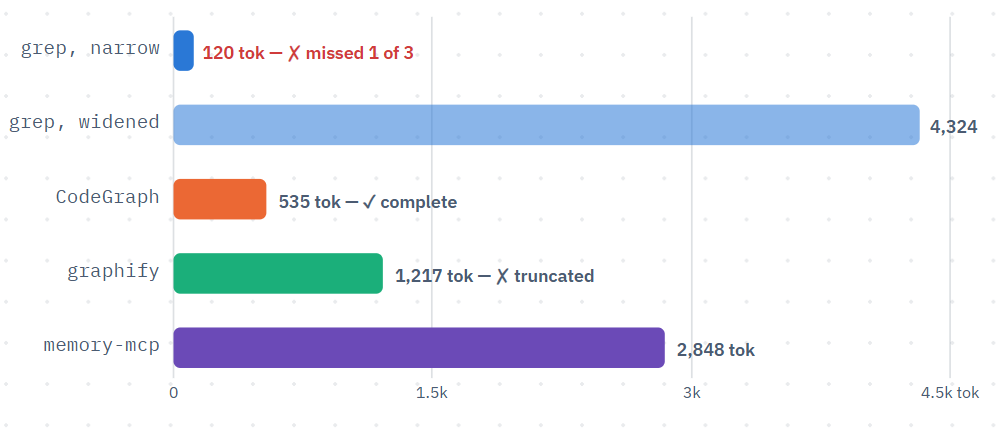
Priced at a standard $3/1M-token input rate, on the input side only. Making the narrow search actually correct costs about 8x more than the graph-based answer, not less — once you widen a keyword search enough to catch a result living in a sibling sub-project, it stops matching only real declarations and starts matching every import and casual reference in the whole codebase. This also excludes the reasoning tokens an agent spends noticing the narrow answer was incomplete in the first place — a real, unmeasured cost. And the narrow answer is the more dangerous outcome, not the cheaper one: it’s confidently wrong with nothing in its output suggesting a follow-up is needed.
- One obviously-named thing, in a hurry, on either repo size
- Zero setup, any directory, any size, right now
- Sanity-checking a graph tool’s answer
- Disambiguating same-named symbols cleanly at both repo sizes
- Pre-resolved caller lists, no untangling, most of the time
- Multi-hop impact analysis in one call
- Multi-hop call chains, fastest of the three once resolved on a small repo
- Best index-build scaling of the three (~47x time for ~49x files)
- The best-handled ambiguity of any tool — tells you exactly what’s ambiguous and lists real choices
- Type-aware call resolution, risk-labeled impact by hop distance
Method notes: one run per call per repo, no warm-cache repeats — timing has ordinary single-run variance and isn’t a rigorous statistical average. The graph-style tool was run in its structural/AST-only mode (no LLM semantic layer) on both repos to keep the comparison apples-to-apples; its LLM-assisted mode wasn’t tested. A fifth tool was attempted on the large repo and is deliberately left out of the tables above: it hit a hard structural ceiling well before producing any comparable answer (a file-count limit far past its own documented threshold), crashing during batch planning before a single analysis pass ran.